Views. See your data transform instantly in front of your eyes.
All your data in Tana starts out as part of an outline, or a knowledge-graph. But changing the View changes how you see, understand and interact with the same data. Switch Views as nonchalantly as if you were picking a colour; it has never been easier.
Your information, literally in-formation
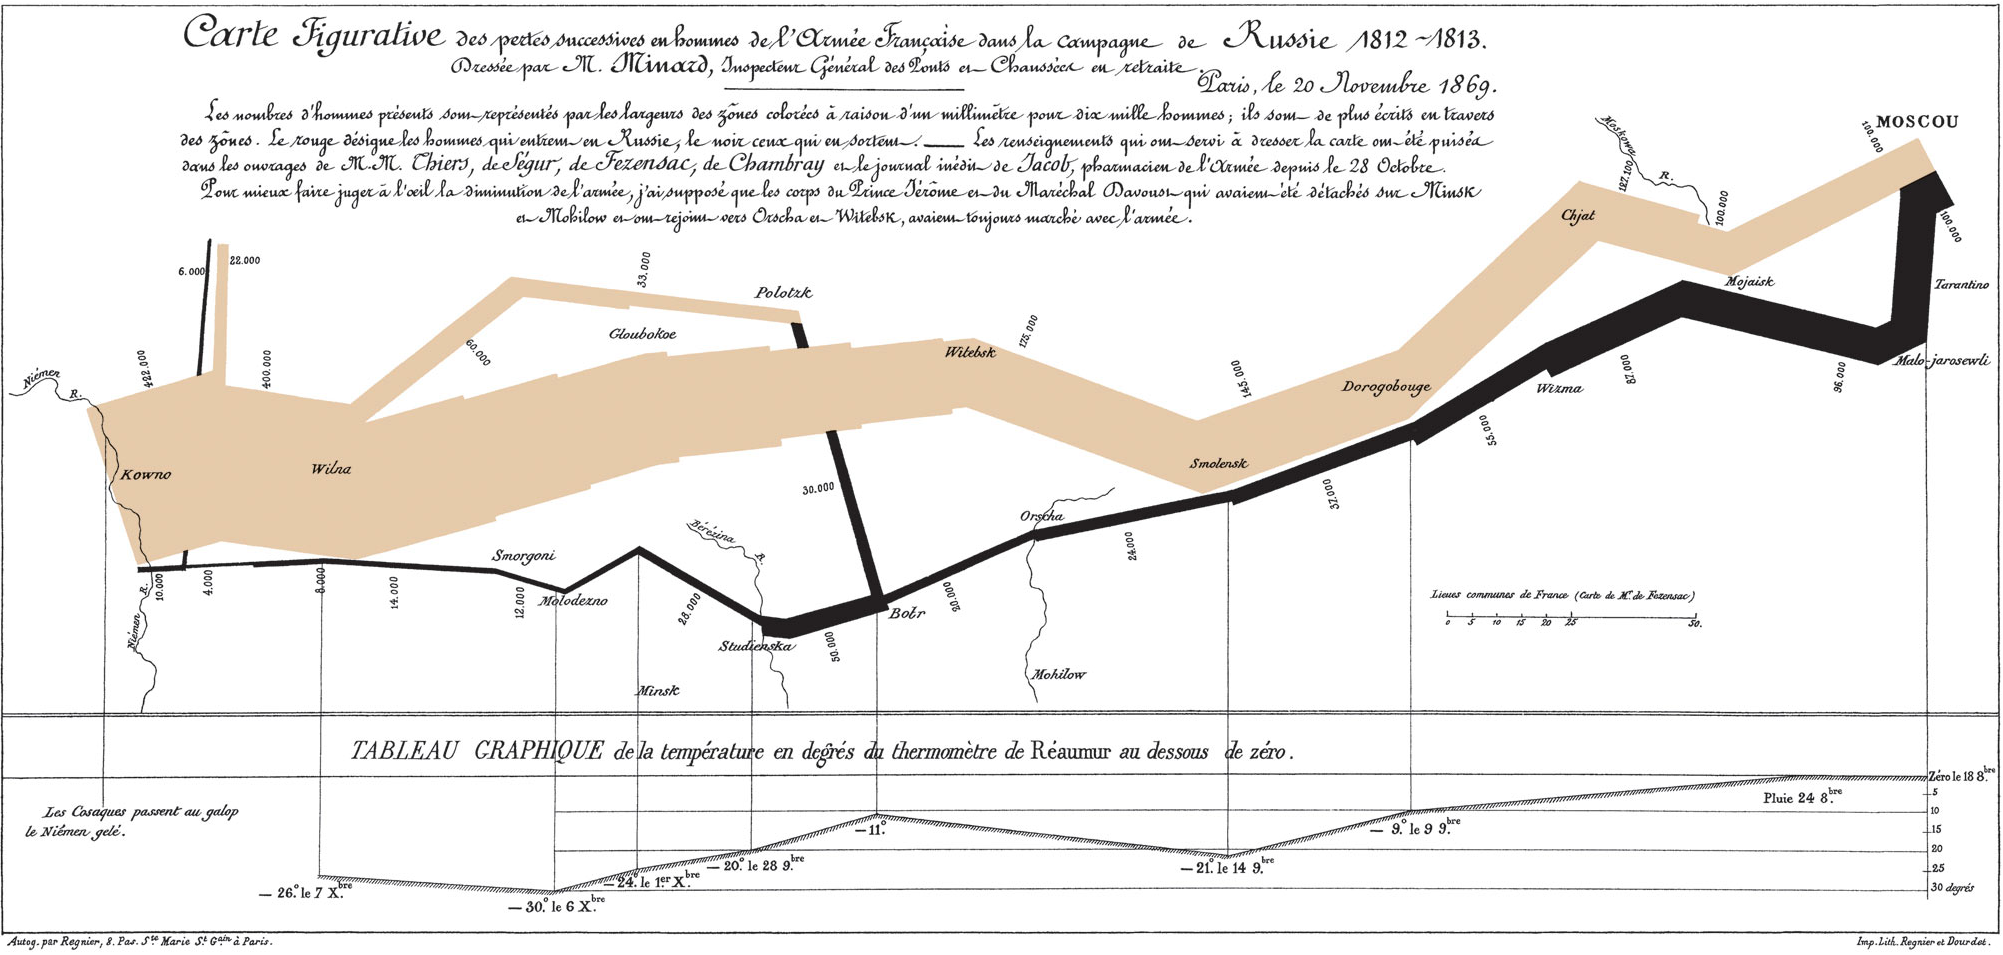
Information was never meant to be locked into one form. The easiest analogy is data. There is a big difference seeing data in its raw, tabulated form versus in a diagram that visually describes the relationships between data points. Information, when seen in different ways, will inspire us to think and interact with it in ways we can't even predict.
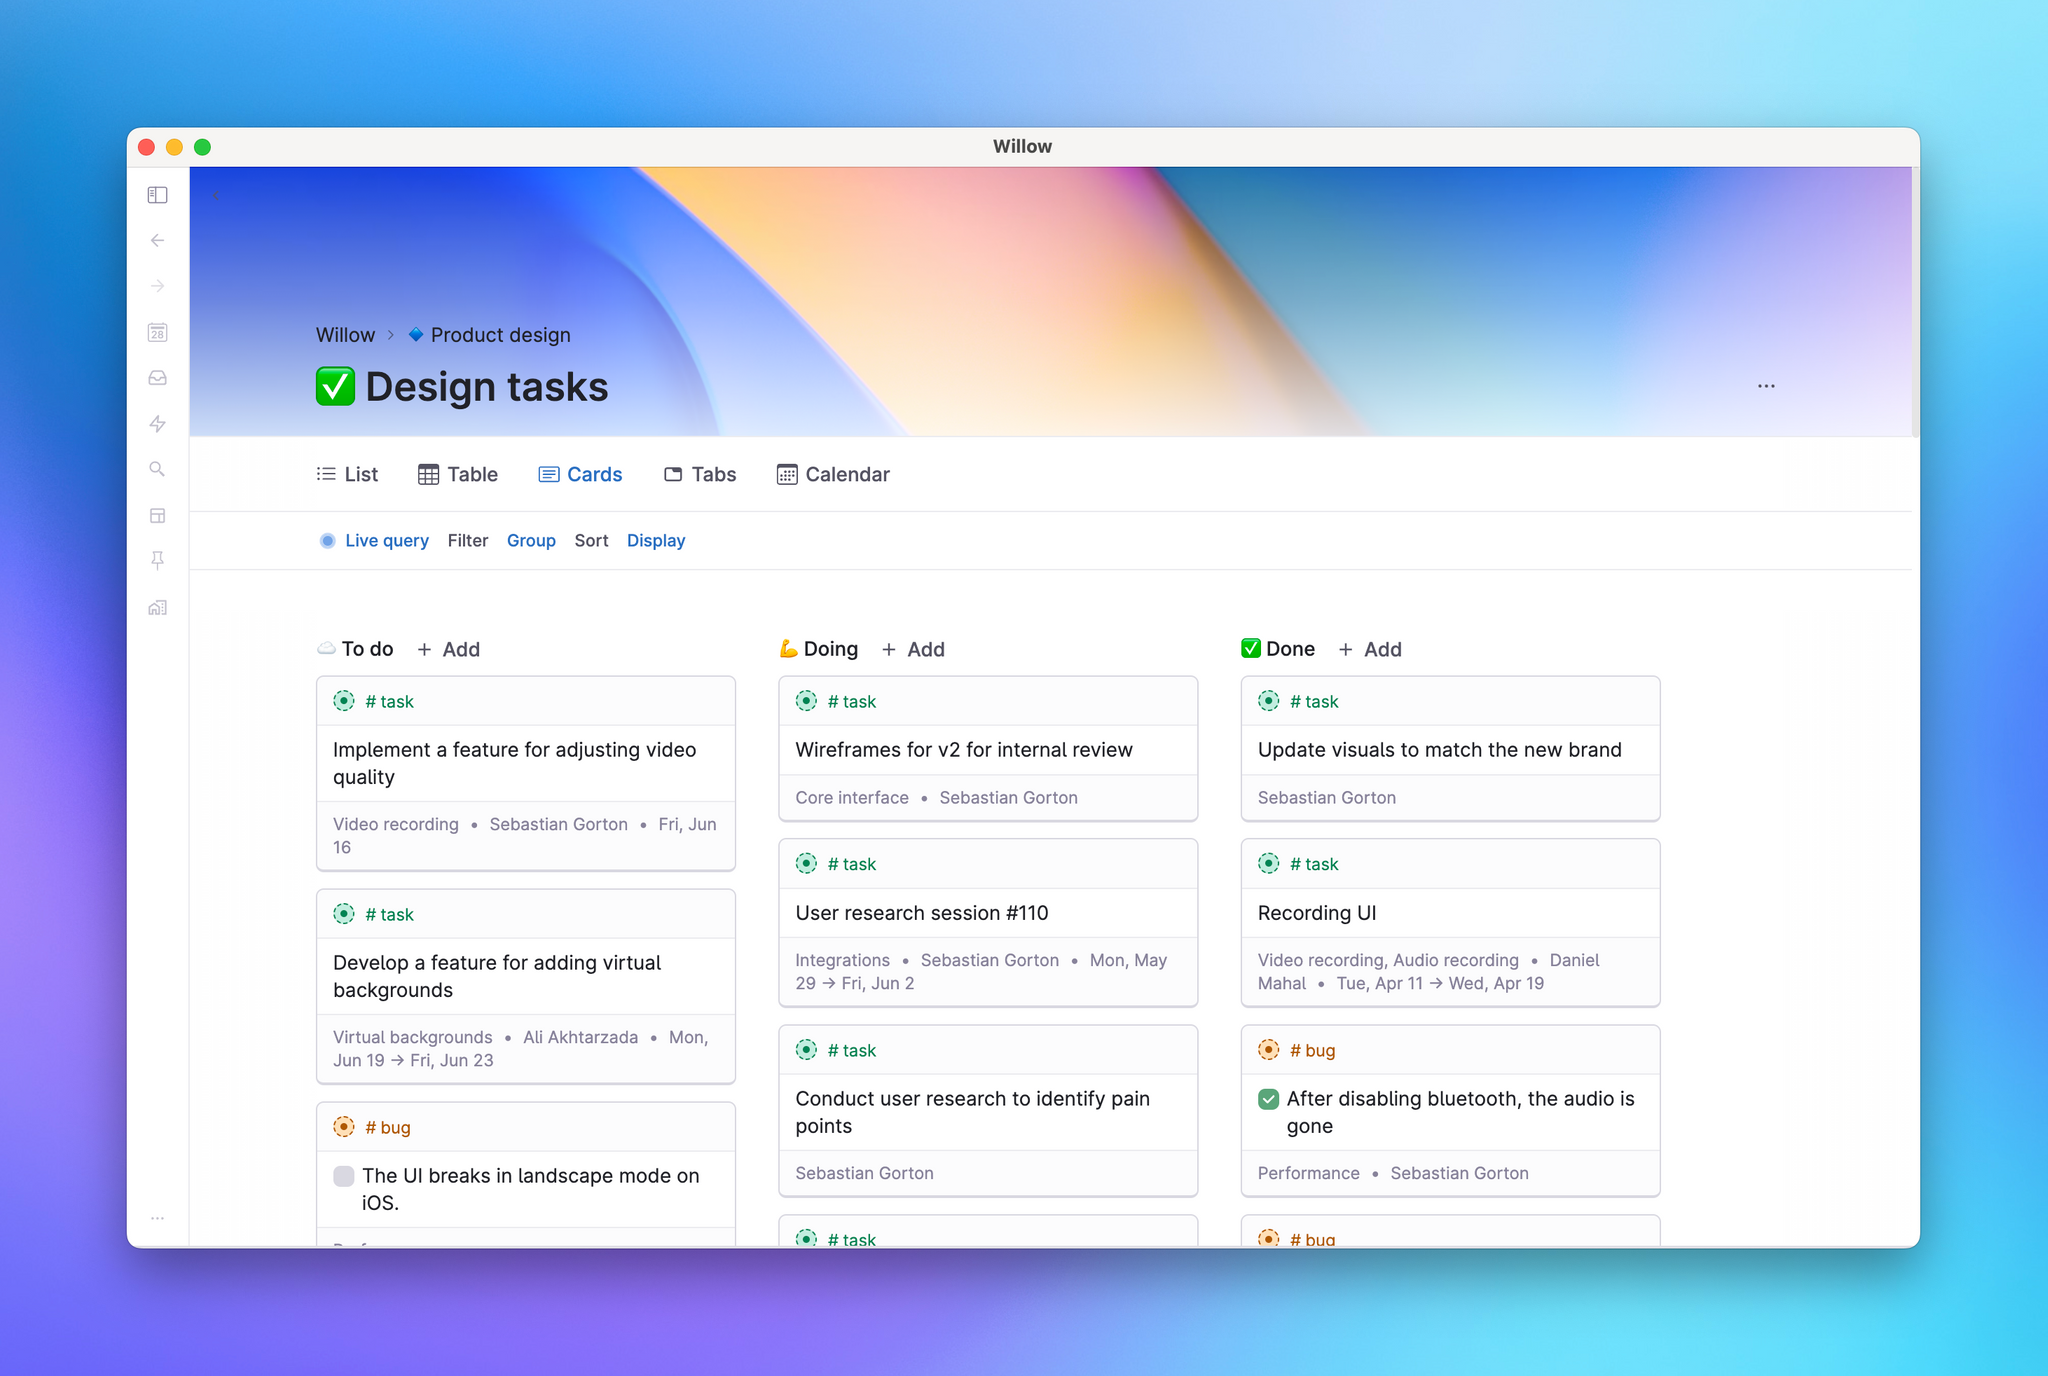
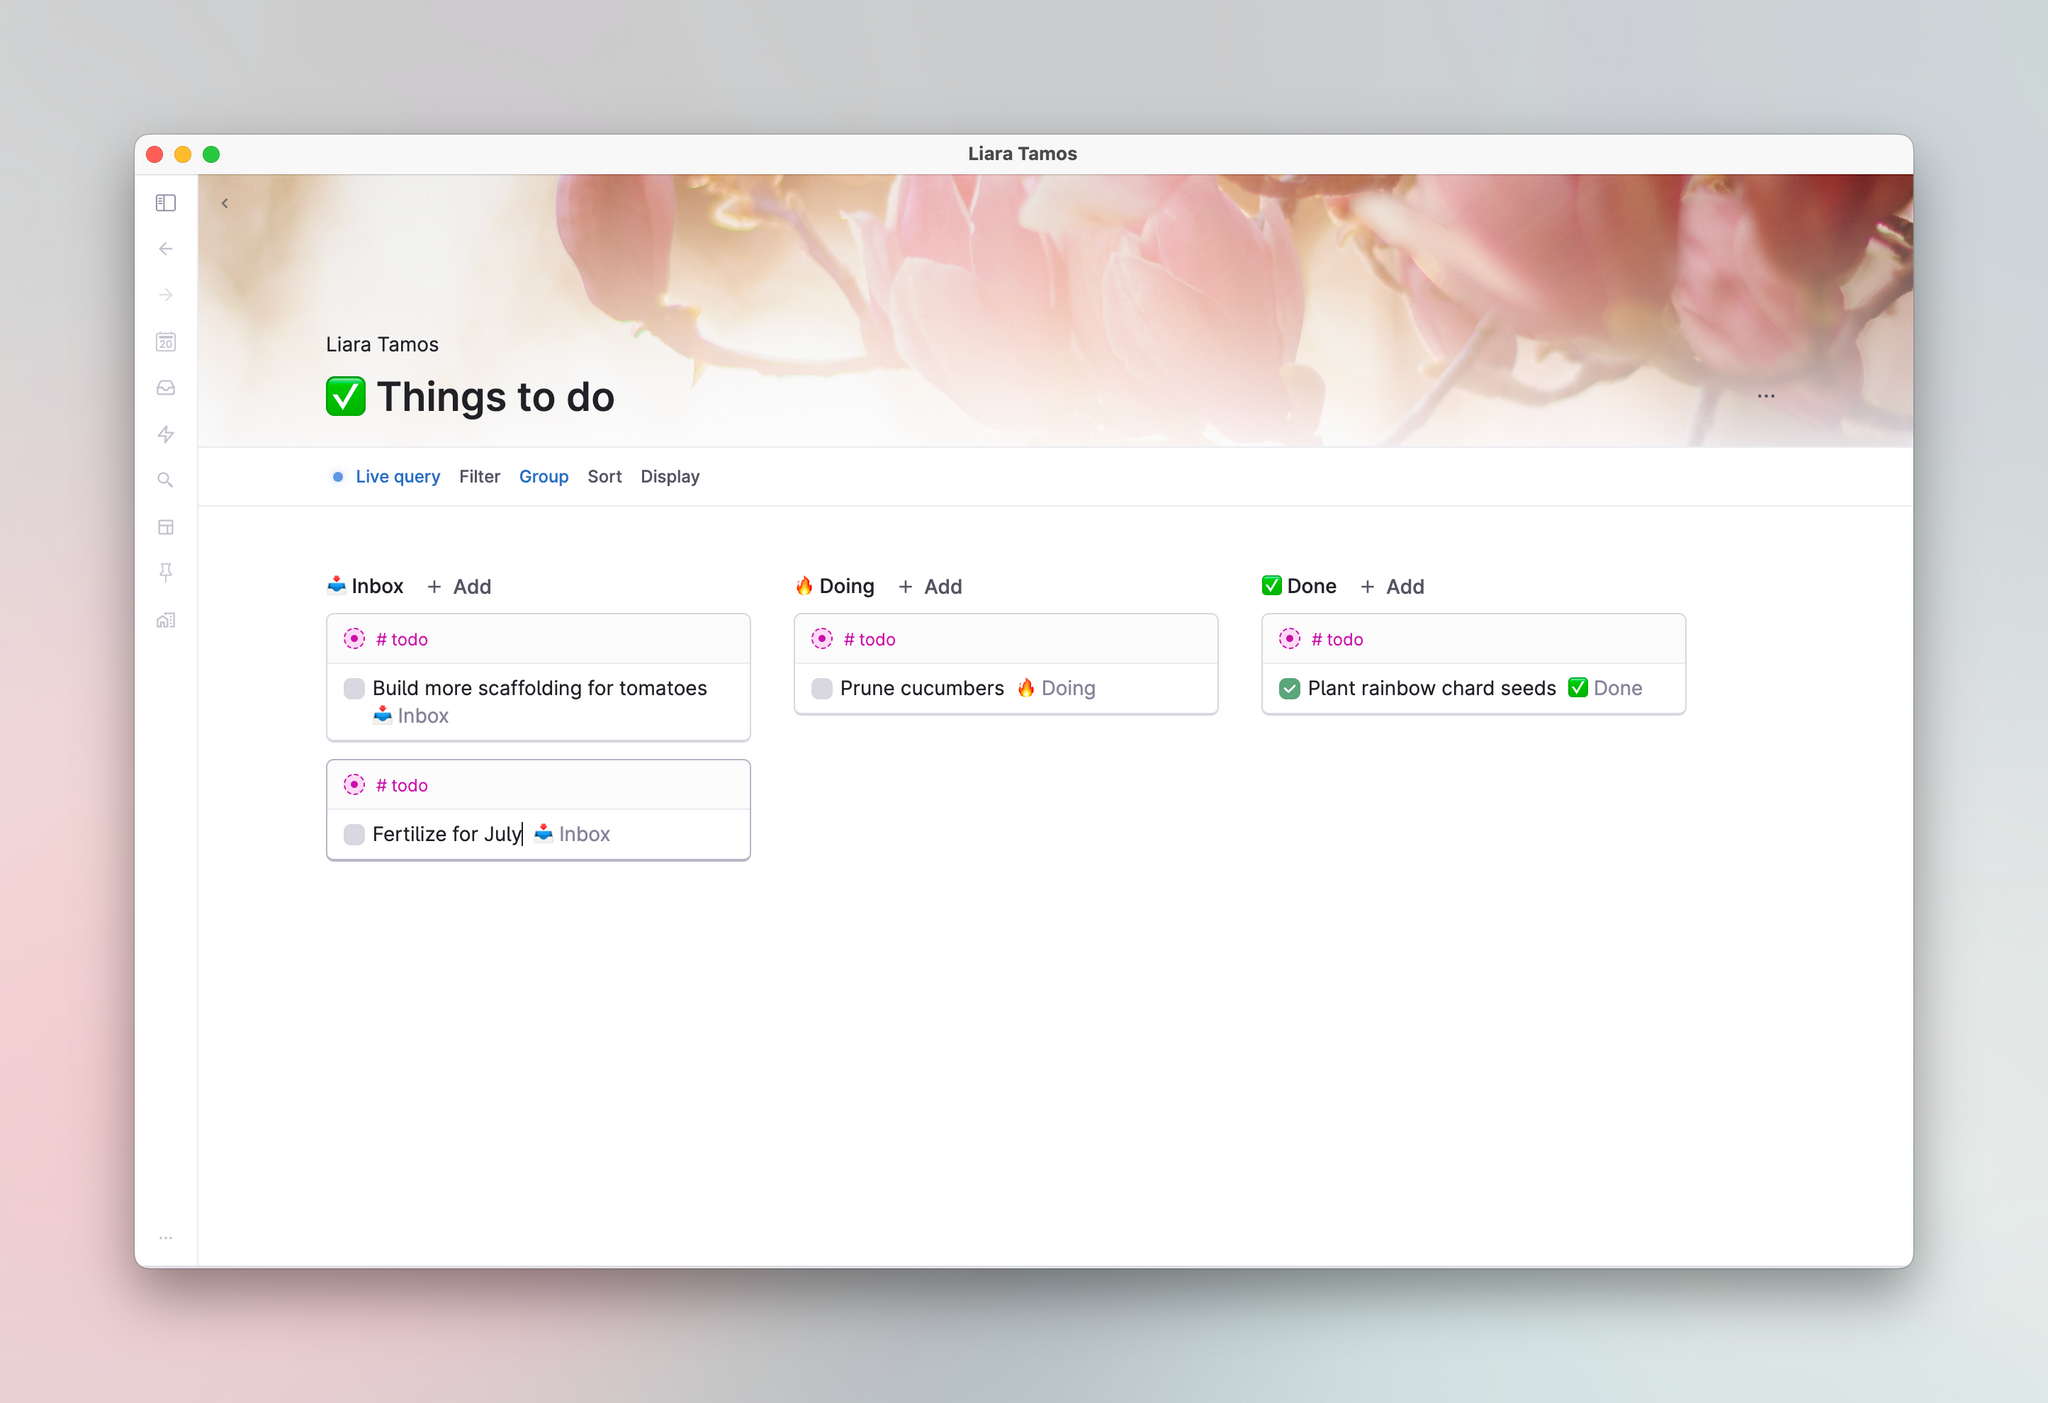
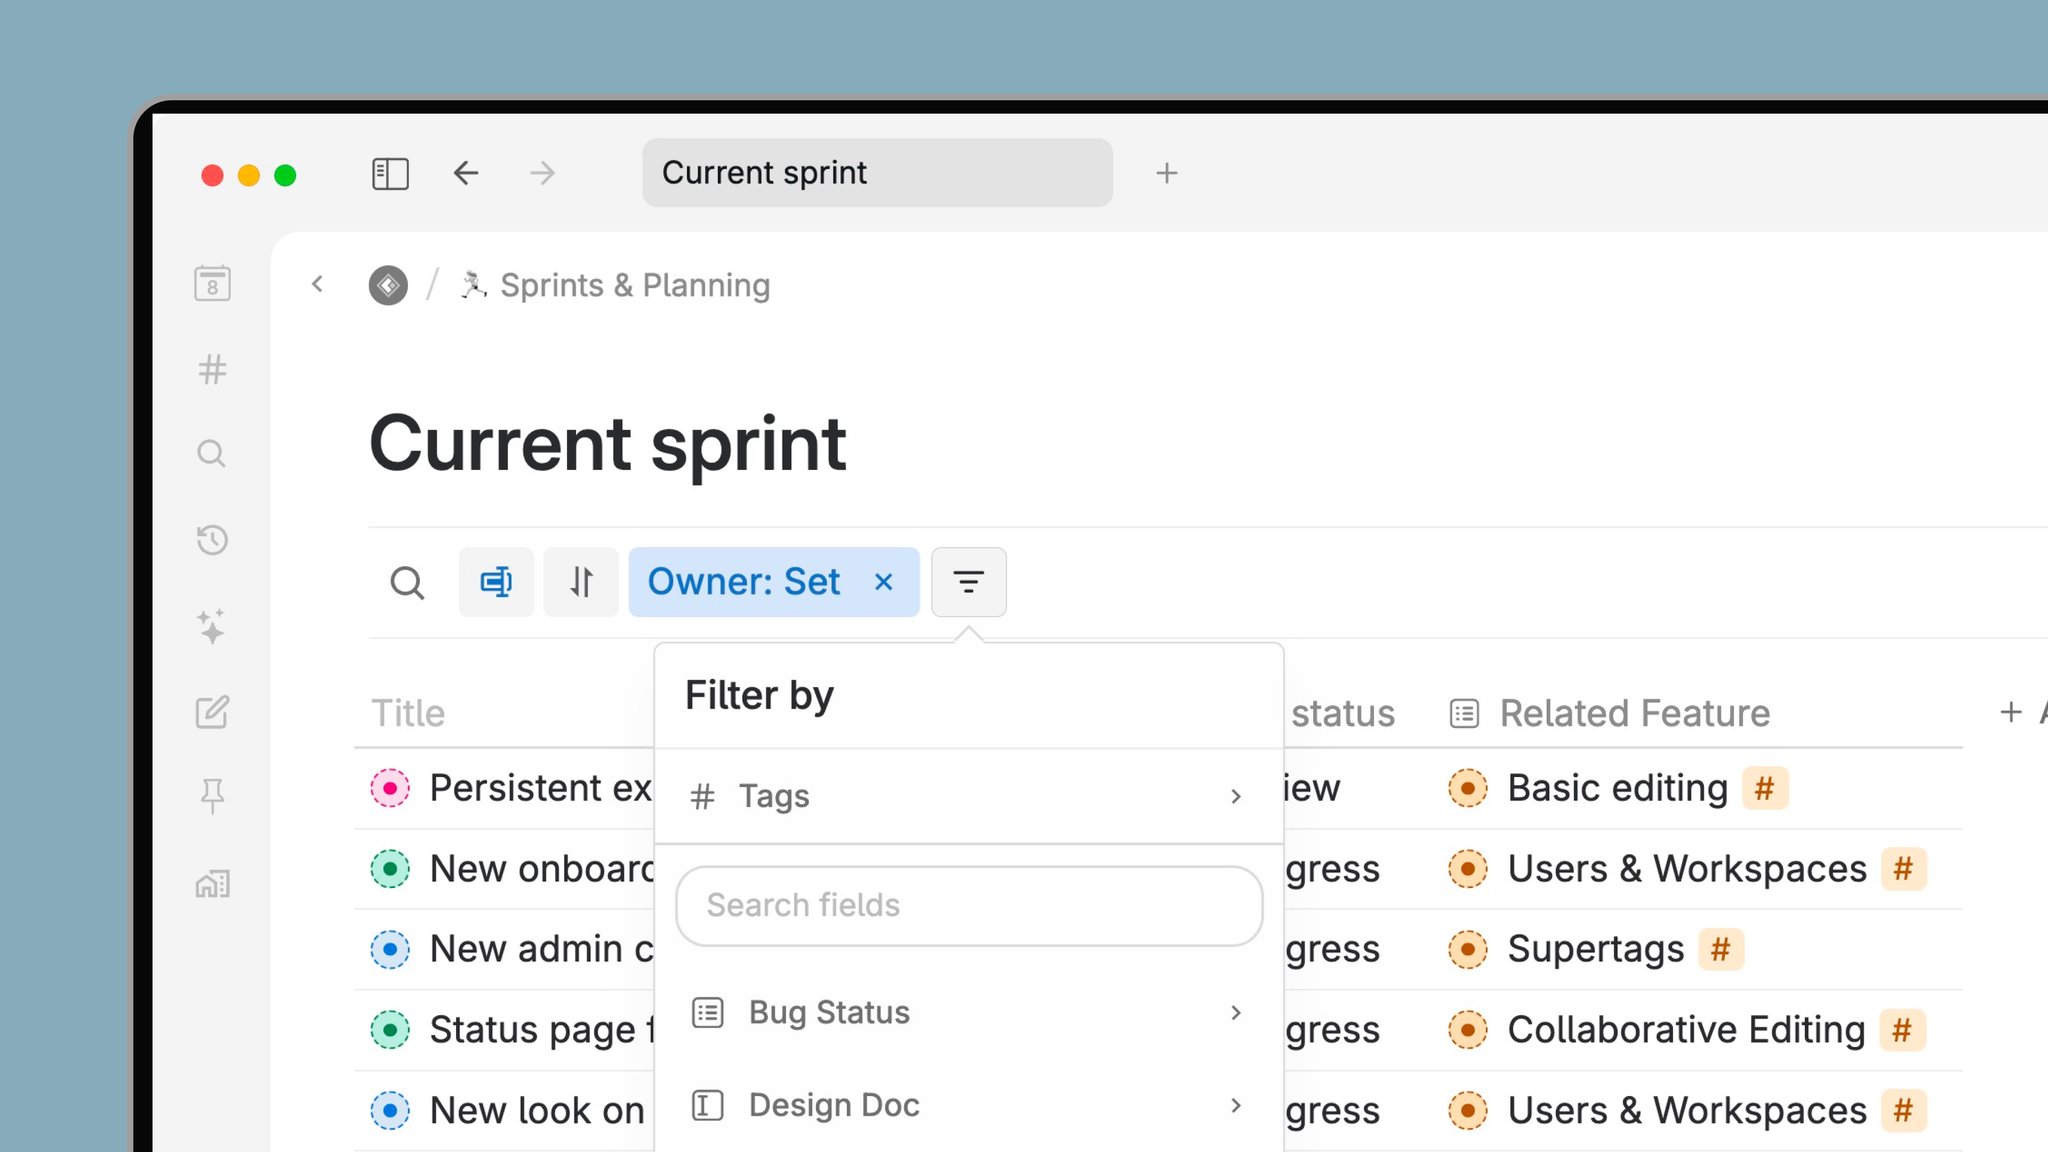
One node = ♾️ ways to see them
One of the biggest benefits of using Tana is that you are building a knowledge graph that uses the outline editor to naturally structure your information. What makes the knowledge graph even more useful is that it can be projected in many different ways. We realized that all apps are just databases projected in one way or the other, and what's being sold are those pretty projections. Could we put the power of projecting information in the hands of our users instead?Our answer is Views. We have translated common ways to look at information, which allow you to transform any bunch of nodes to look totally different in an instant. Currently, nodes can be seen as a list, table, cards, tabs, and calendar, and we have more than a dozen other views that we are researching or are in development. When it comes to Views, our imagination is the limit.Views are the key to unlocking information from their static existence. Views let your information and knowledge come alive.